It doesn't replace those who measure or those who warn. It comes in as the missing analysis layer — behind the dashboards and situation rooms the agency already has.
Platform · Climate and risk intelligence
The climate has already changed. So has the way we decide.
The 4DClima turns official, scattered climate data into a ready-made diagnosis — with the proof behind every number in plain sight. Rivers, rainfall and the planet's great phenomena over the memory of each place, across three time scales: the next few hours, the coming months and the coming decades.
Governments already measure and already warn. 4DClima tells what each measurement means for that place — with the proof and the hit rate behind every number.
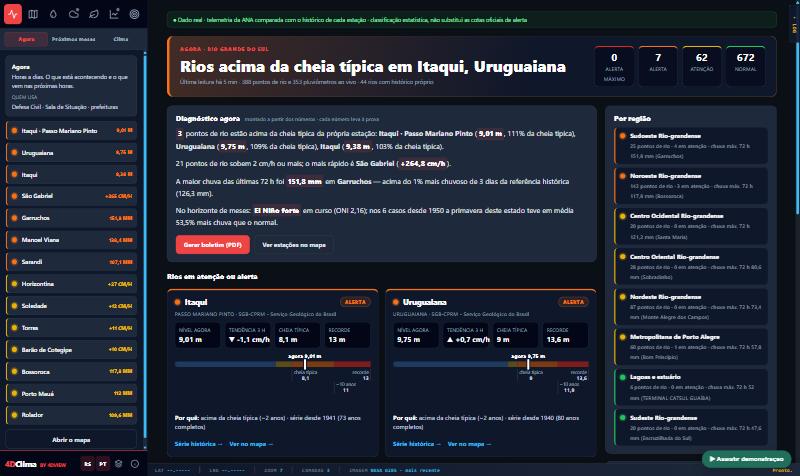
The missing layer
Not another portal. The intelligence behind what you already have.
Measuring and warning is already done. 4DClima goes where no one goes: telling what each measurement means for that place — comparing every river, every forecast rainfall and every station with a century of the point's own memory, with the proof and the hit rate behind every number.
It replays a past event using only the data available before it — and shows how many days earlier the signal would have fired. In Rio Grande do Sul, with the gauges from before the May 2024 flood.
It publishes its own method's hit rate — which almost no one does. When it does no better than chance, the screen says it plainly: no signal.
An assistant that only answers with the system's own data and cites the source — it invents no figure, no deadline, no regulation.
It generates the bulletin ready to take to the situation room and the official alert channel: it feeds civil defense, it doesn't replace it.
01
Three questions, three time scales — one single foundation.
Those who look after climate and risk ask three different questions. 4DClima answers all three on the same official data foundation — from the alert happening now to the trend of the decades, with the same proof.
For civil defense and situation rooms: each river compared with the history of its own station, each rainfall with the extreme of that place.
For those who plan water, agriculture and energy: each region's rainfall cross-referenced with the great climate phenomena — and the hit rate always in plain sight.
For climate advisory teams and adaptation: using only what has already been measured, whether the region's climate is changing — with a statistical test behind every number.
02
See the platform in action.
The narrated presentation and the live platform — the same foundation that serves civil defense, the environment and water.
03
The memory of each place.
The heart of 4DClima is memory: decades of official measurement, day by day, organized to answer simple questions. It is not a generic threshold — it is the history of every point in the territory.
Measured since 1941. The highest reading in the entire series was on 2 May 2024: 23.14 m. The second, in September 2023 — the two largest floods, back to back.
The wettest day in the series: 5 December 2015, with 212.8 mm — storm Desmond, almost four times the typical extreme day for that place.
A heat map with every day of every year, the current year against all the others, the ranking of the largest floods and the wettest years.
04
What lies ahead — and how far you can trust it.
4DClima cross-references each region's rainfall with the planet's great climate phenomena — El Niño, the North Atlantic Oscillation, the Arctic Oscillation, the Indian Ocean Dipole, tropical Atlantic temperatures and others — and discovers on its own which one matters in each place. No one writes that by hand: it comes from the data.
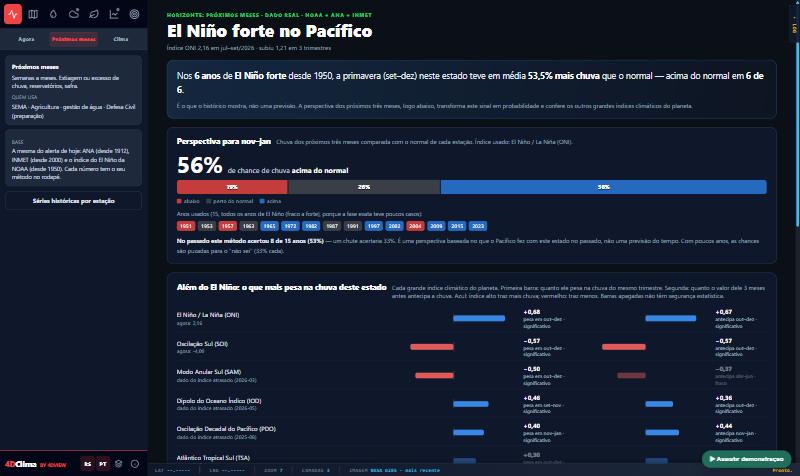
The engine found El Niño — a +0.68 correlation with October-to-December rainfall, across 76 years of data.
It found the temperature of the South Tropical Atlantic — not El Niño.
It found the Arctic Oscillation, the sister of the North Atlantic Oscillation.
The outlook for the next three months comes with the method's hit rate in the past. When it does no better than a guess, the screen says: treat it as no signal.
The numerical rainfall forecast is compared with the memory of each place: it does not only say how much rain will fall — it says whether that is a lot for that place.
05
What is changing over the decades.
Using only what has already been measured — no model, no projection — and with a statistical test behind every number.
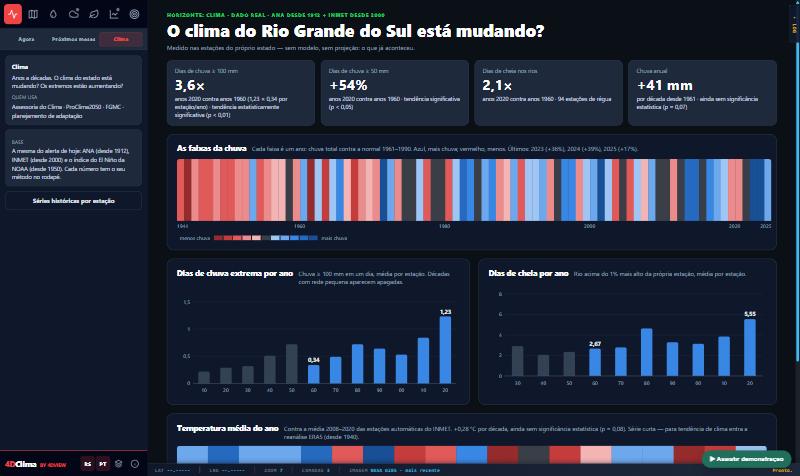
Days with rainfall above 100 mm became 3.6× more frequent from the 1960s to the 2020s (a statistically significant trend); days of river flooding, 2.1×.
Days with rainfall above 100 mm became 3.8× more frequent since the 1990s; annual rainfall is rising by 134 mm per decade; days of river flooding have nearly doubled since the 1970s.
06
Rigor and honesty, on principle.
4DClima shows what is happening, what lies ahead and what the past teaches — and it is transparent about its own limits. It does not replace official alerts.
Every underlined number opens up where it came from, how it was calculated and when. In a public body, that is what sustains a decision before anyone who asks about it later.
It shows the hit rate of its methods, marks what is not yet connected, and prefers to say "no signal" rather than invent a probability.
Trends with Sen's slope and the Mann-Kendall test; correlations with the trend removed and significance corrected; outlooks validated by leaving each year out.
National water and meteorological agencies, environmental agencies, NASA satellites, numerical forecasting and NOAA climate indices.
Each client chooses where their data lives: in their own country, in their own region, under their own rules.
07
For whom.
The same foundation, for the whole decision system — civil defense, the environment, water, agriculture and planning looking at the same numbers, with the same proof.
What lit up just now, river by river, and what lies ahead in the coming days.
The trend across decades, with proof, to plan adaptation.
Reservoirs, droughts and excess water in the coming months.
Climate risk by region and by harvest; vulnerability of settlements and communities.
A single, auditable foundation, comparable across regions and countries.
08
Ready for any region in the world.
4DClima is not a single-state system. It configures itself for any area of the planet — a state, a country, a river basin, a consortium of municipalities, a group of rural settlements.
Satellites and global climate phenomena already cover the entire planet.
Each country's official stations come in through their own connectors — today with Brazil (ANA and INMET) and England (Environment Agency); ready for Germany and Finland.
The interface speaks Portuguese, English, Spanish, Italian, French and German — and so does the narrated demonstration.
Each client sees only their own area, in their own language, with controlled access.
09
100% Brazilian technology. Data under your control.
The technology is developed in Brazil; the data stays wherever the client requires — in their own country, in their own region, under their own rules. Cutting-edge climate intelligence, built in the country, with sovereignty over the data of whoever is responsible for it.
10
See ahead, with rigor and with proof.
Climate disasters cost lives, cities and decades of development. Seeing ahead, with rigor and with proof, is the first step to deciding better. It starts with a pilot region, using the official data that already exists.
Bring 4DClima to your region.
Tell us which territory you need to see — we show you the platform with your data and where to begin.