Aedes breeding sites in closed properties and vacant lots — what a foot patrol cannot reach.
Platform · 4DView's flagship
4DMap — the whole city, replicated in data.
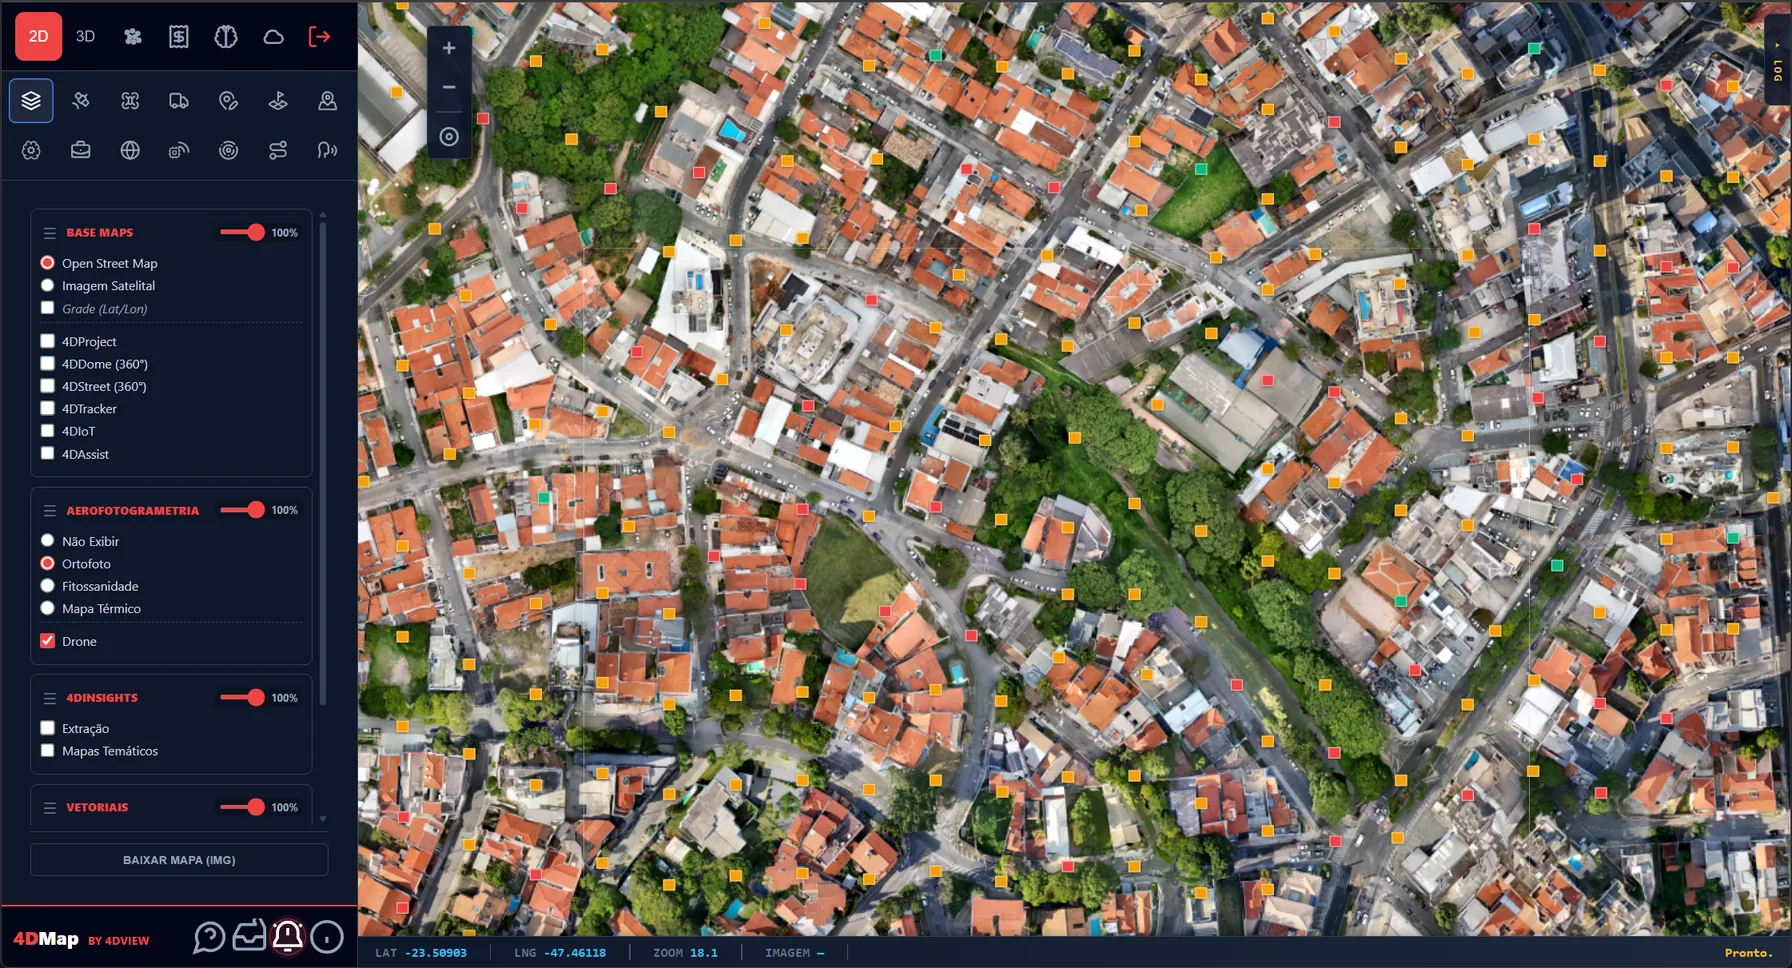
Drone, satellite and LiDAR become orthophoto, 3D model and 360°. Over this digital twin, the intelligence spatializes any data, georeferences it, cross-analyzes and projects it over time — and the AI sees, reports and answers. From the territory to the decision, in a single web platform.
01
Four dimensions: what, where, when and how.
Governing well means seeing the event in place, in time and in context. That is what 4DMap delivers — not a photo of the territory, but the territory that can be measured, compared and projected.
WHAT
The event
Incidents, projects, sensors and administrative data, tied to the place.
WHERE
The territory
Map, orthophoto, 3D model, point cloud and 360°.
WHEN
Time
The date of each image and record — comparison and animation over time.
HOW
The context
Documents, reports, indicators and history behind each event.
02
See the platform in action.
The same thing municipalities use. Drag, rotate, explore.
03
The city captured — and examined by AI.
About 1,100 images of 48 MP per km². The flight plans itself — from the outline of the area to the package ready for the drones — and becomes orthophoto, a navigable 3D model, point cloud and aerial and street 360°. Over the images, you describe what to look for and the AI goes through everything, flags each finding with its severity and coordinate, and generates a report.
Orthophoto & 3D
High-resolution georeferenced imagery and a navigable 3D model in the browser — no engineering workstation.
Point cloud
Density, measurement and altimetry — terrain, drainage and volume ready for study.
360° with AI report
The aerial (4DDome) and the street (4DStreet) in 360°; the AI sweeps the panorama and marks the problem at the exact angle.
04
Tools no one had brought together — now talking to each other.
Data integration, multidimensional BI, data science and artificial intelligence in a single layer — what the market sells separately, working together here. The municipality gets to see what happens across its territory without needing a data analyst.
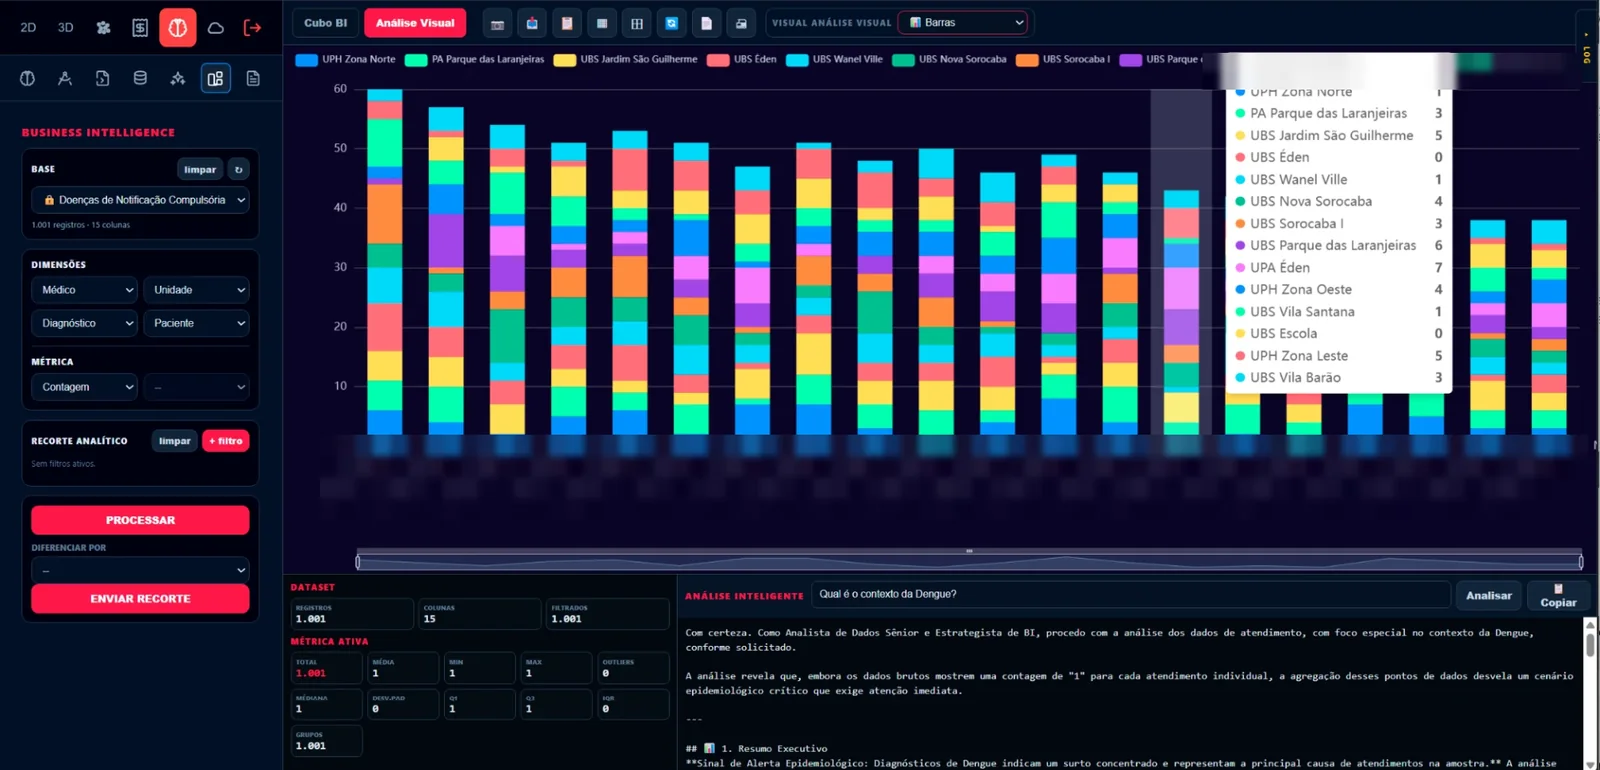
Demonstration data, with anonymized names.
01 · Integrate
APIs from other systems or spreadsheet imports bring the data in.
02 · Cross-analyze · BI
Multidimensional cube: you order the dimensions however you like, slice and drill down.
03 · Analyze · Data Science
Histogram, scatter, outliers and radar over all the data — without oversimplifying.
04 · Discover · AI
The AI reads the cross-analyses and the statistics and tells you what is happening — without the municipality needing an analyst.
05 · Georeference
Every conclusion is born in the right place, over the dated image of the territory.
06 · Show time
Heat map, proportional bubbles and time-lapse — a map that turns into a video of the phenomenon.
05
An intelligence that remembers — and that thinks.
The agency's repository — regulations, plans, opinions and contracts — becomes a graph that answers in natural language: 4DCoPilot, the municipality's memory. And the 4DArchitect pipelines turn an idea into a complete study, driven by dozens of AI agents that only propose after understanding the territory.

Public sector
From the diagnosis of the territory to the solution. 7 blocks · 43 agents.
Private sector
Complete study in Word, PDF and PPT. 6 blocks · 36 agents.
Individuals
The same pipeline, a different audience. 6 blocks · 36 agents.
Revenue audit
Dossier, matrices and project portfolio. 5 blocks · 24 agents.
06
From the office to the team in the street.
The public-works portfolio seen as a single organism — and the operational front line in real time, with a layer that sees the physical world.
4DProject · Situation Room
The entire portfolio in one panel: global schedule, cash flow and planned × actual — and where projects contend for the same teams and machines. Each project with CAPEX, OPEX and Gantt.
4DTracker · field in real time
Live location, photos and audio — with the screen off; SOS for inspectors, reconstructed route and optimized multi-stop routing.
4DIoT · the physical world on the panel
Live sensors, stations and cameras, with automations and alerts — from a panic button to an entire management room, under open protocols.
07
And the citizen, served over WhatsApp — 24 hours.
4DAssist and 4DZap serve residents with AI on the official WhatsApp API: they understand text, audio and image, open a ticket, put the incident on the map and call a human agent when needed — with a knowledge base fed by the agency's documents.
08
Where the image becomes action — and revenue.
Every case flagged by the image is confirmed by the team before any action. From the public sector to the private one.
Built area versus the registry, irregular construction and deforestation — inspection by evidence, not by luck.
Slope movement through compared 3D and streets hit by flooding, from the topography.
Bridges and overpasses where human access is expensive; potholes counted to guide the patching.
Registry situations that lead to regularization and to updating the tax base.
Inspection of roofs and towers, thermal analysis and point cloud in CAD/BIM, measurements and inventory.
09
Robust inside. Secure by principle.
Each client is an isolated project; every access goes through a single control point. Libraries on our own server, no CDN — and AI that observes the LGPD: it does not invent deadlines, values or regulations.
Application
PHP 8 and JavaScript, with no build step.
Data
PostgreSQL with pgvector for semantic search.
Map · 3D · 360°
Leaflet, Three.js/Potree and Marzipano.
Documents
PDF, Word and PowerPoint generated in the browser.
Real time
MQTT bridge, Mosquitto broker and live video.
AI
Language, vision and embeddings, with a configurable provider.
Public sources
IBGE, National Treasury, Central Bank, CNJ, Sentinel-2 and OSM.
Isolation
Each user restricted to their own project; evidence with temporary links.
10
Not standalone software. It's a method.
What you contract is the 4DMap Integrated Methodology — territorial engineering, data science and management intelligence in a single platform. It starts with a pilot area and grows by modules, in the order of your priorities.
Let's talk.
Get in touch and we'll set up a meeting to present the platform and explain how we can help your municipality.